Project Cards: The full picture on any project, at a glance
Across data sets on renewable projects and technologies, it is often hard to tell which projects are alive or stalled, and there is little transparency in where the numbers come from. That makes it hard to compare opportunities and to understand whether, and where, projects and markets are moving.
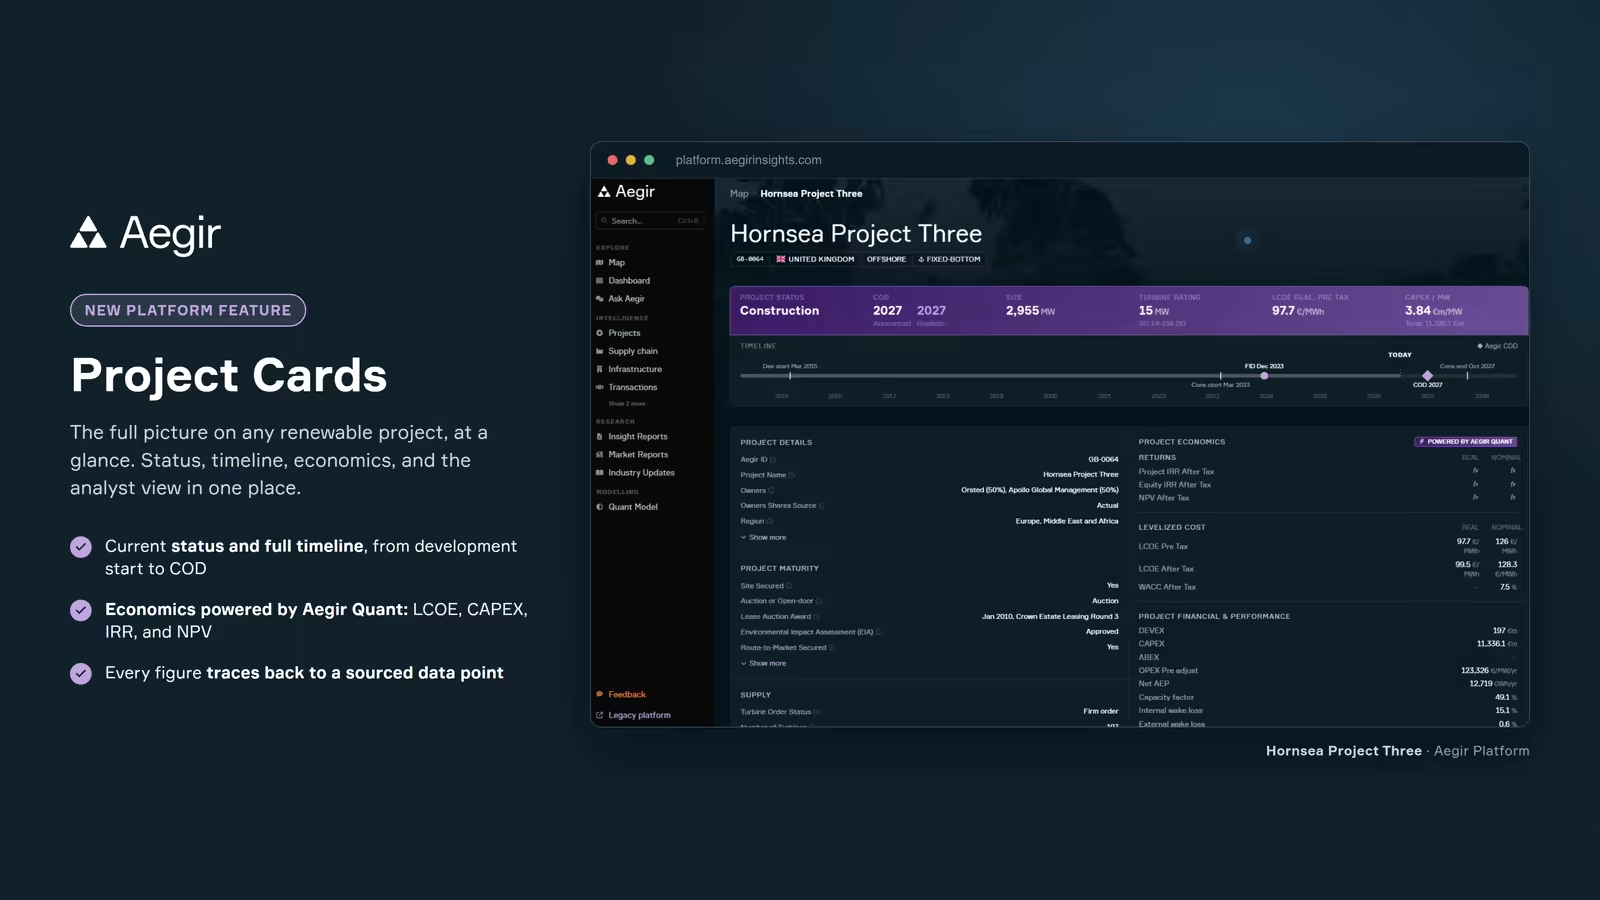
Project Cards solve this. They give you everything that matters on a project in one place:
What's on a Project Card
- Current status and the full timeline, from development start to COD.
- Announced and realistic COD, side by side.
- Capacity, turbine rating, owners, and supply chain status.
- Project maturity: site, permitting, grid, and route to market.
- Project economics powered by Aegir Quant: LCOE, CAPEX, IRR, and NPV.
- The analyst view, highlighting the key risks and opportunities.
Built on traceability
Every figure on a Project Card traces back to a sourced data point. What you read at a glance, you can bank on. That is the whole point of the card: not just a fast summary, but a fast summary you can defend to a lender, an investment committee, or a board.
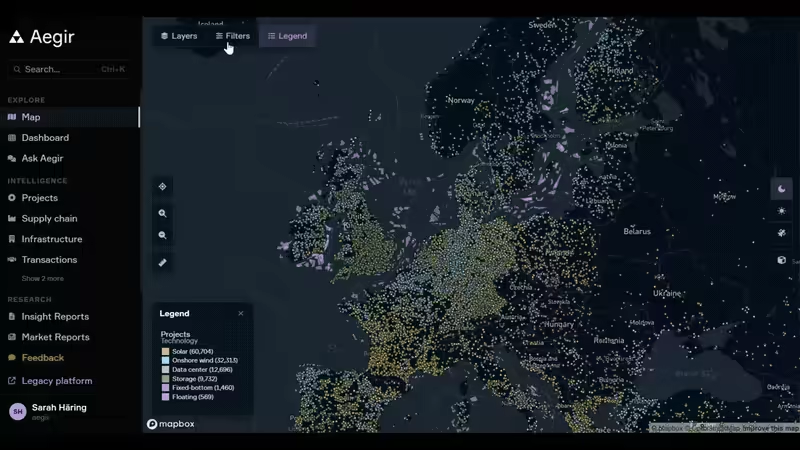
Project Cards cover 100,000+ projects across onshore wind, offshore wind, solar, storage, and data centers, so the same view works whether you are screening a single project or scanning an entire market.
Try it on the Platform
Request access to the Aegir Platform and open a Project Card on any project that matters to you.