Data centers in Europe: Where they are being built, and how big they are
Instead of mapping where data centers are today, the better question to ask is where the future ones will be, and how big they will be when they arrive.
What is running today reflects decisions made years ago. What is under construction now is the better read on where capacity is heading. Announcements are cheap, but capital only goes into the ground once a project is committed: grid connection secured, consents in hand, financing closed.
The US leads by a distance, but that is the familiar story. Here we focus on Europe, where multiple countries are following suit, the race is closer, and grid limits matter as much as demand.
Where is Europe building data centers?
From the Aegir Insights data center database, mapping 10,000+ data centers globally, we summed disclosed capacity under construction across every European market, all data center types, each facility traced to a primary source.
- United Kingdom: ~1,700 MW
- Germany: ~1,580 MW
- France: ~650 MW
- Switzerland: ~560 MW
- Ireland: ~500 MW
Two tiers stand out: the UK and Germany together carry nearly double the other three combined.
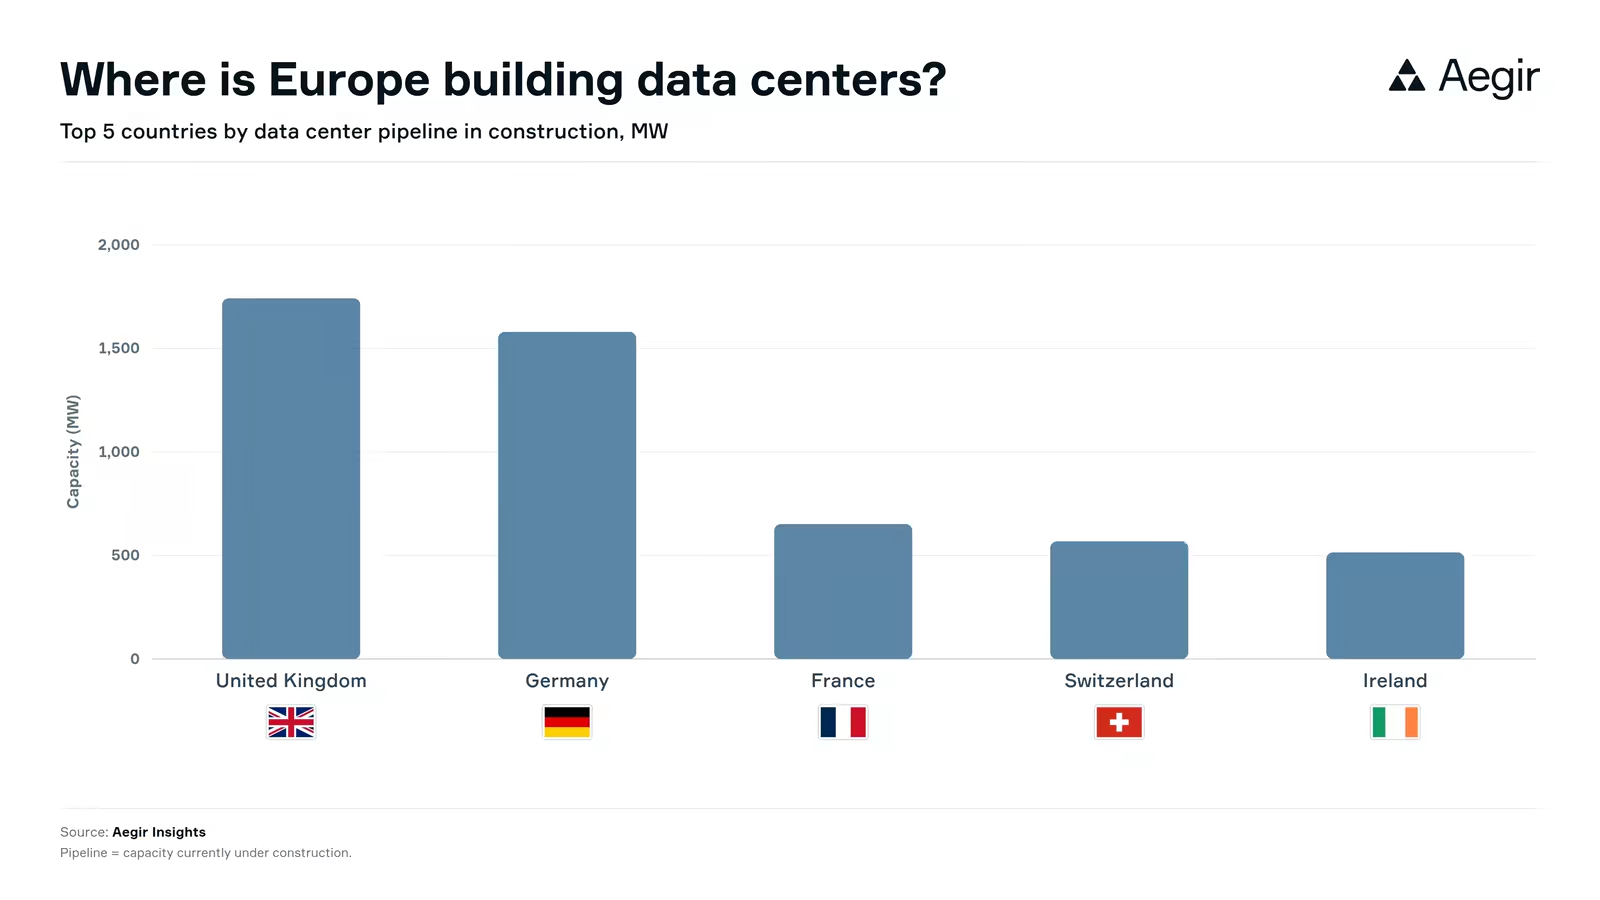
Aegir Insights data center database, June 2026. Capacity under construction, all data center types. Disclosed nameplate capacity only, so totals are floors. Source: Aegir Insights.
These are conservative totals. We count only capacity that operators have publicly disclosed, so the real figures most likely sit higher.
Ireland is the one to watch: lowest of the five today, but with Dublin's grid moratorium lifted late 2025, its wider pipeline could run far ahead of this figure.
How big is a data center in Europe compared with the US?
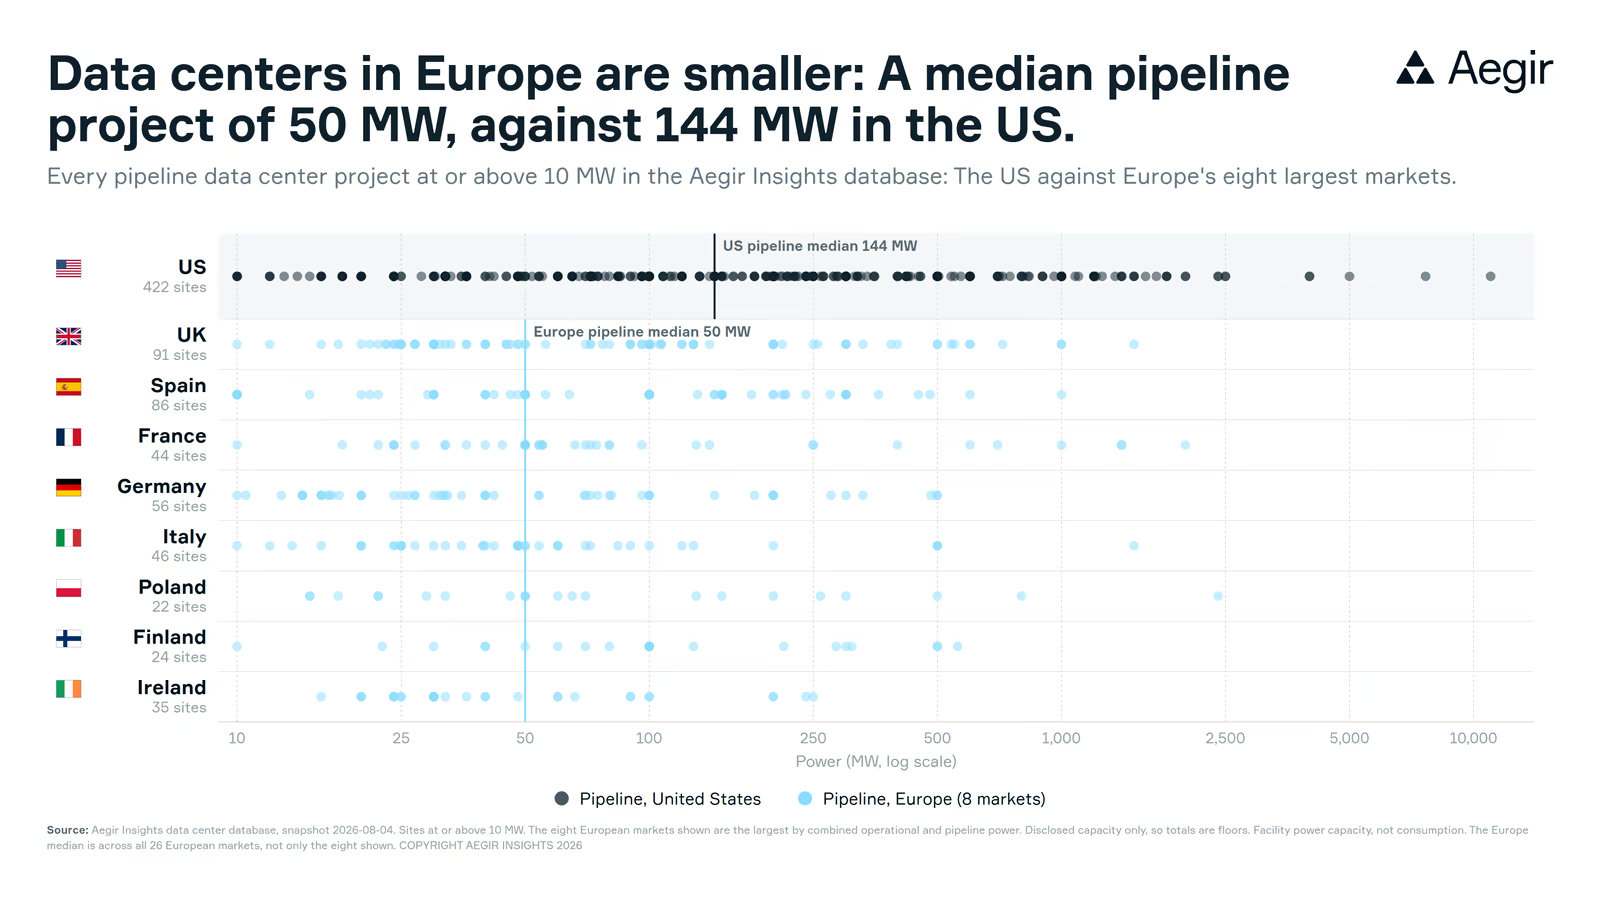
Counting every project under construction, in development or planned at 10 MW and above, the median project in the US pipeline is 144 MW. In Europe it is 50 MW, almost three times smaller.
The gap is widest at the top end. The US pipeline holds 44 mega projects of 1 GW or larger. Across Europe there are just 10.
How big is Europe's data center pipeline?
Europe's pipeline is not small. Counting the same set of projects at 10 MW and above, it has inflated to 66 GW, against 158 GW in the US. The US pipeline is roughly two and a half times larger in total power, while its individual projects are nearly three times the size.
Is Europe building data centers faster than the US?
Relative to what it already runs, yes. Europe's pipeline is around seven times its operating fleet, against under four times in the US. But it starts from a much lower base: about 9 GW operating in Europe against 44 GW in the US.
What is driving the build-out?
The same workload on both sides of the Atlantic. Roughly 60% of both the US and European pipelines is AI and high-performance computing build-out, so the difference between the two markets is not what they are building for. It is the size of the unit each one builds it in.
Why project size decides what the grid has to absorb
A pipeline this size is a different problem depending on how it arrives. Spread across many 50 MW sites, much of it can be fitted around existing infrastructure. Concentrated into gigawatt campuses, each one becomes its own transmission project. Europe's pipeline is currently the first kind and the US pipeline is increasingly the second, which is why the two markets are running into different constraints at the same moment.
The challenge with a pipeline this ambitious is that grid operators and policy makers cannot keep up with the momentum. Connection queues, substation capacity and transmission limits bite long before demand runs out.
The common thread is the grid
That is why we map every data center next to the infrastructure that has to feed it: Substations, transmission, interconnectors, and the renewable pipeline being built to power it. We also track each project's development and maturity, so you can tell real progress from a press release.
Aegir Insights covers cross-technology infrastructure: Offshore wind, onshore wind, solar, storage and data centers, with every project traced to a source. The full dataset, by country, stage and site, sits in Aegir Analytics™. Reach out for a walk-through.