Offshore wind supply chain bottlenecks: What actually constrains the build-out
The offshore wind build-out is not constrained by ambition, and on our numbers it is not constrained by pipeline either. Our Q2 2026 Market Forecast still expects 91 GW installed globally by 2030, rising to 259 GW by 2040, excluding China. Those volumes sit close to where they sat a quarter ago.
What moved is the assumption underneath them, and it moves the constraint rather than removing it.
What changed in the Q2 2026 assessment
We have delayed the introduction of larger turbine ratings by five years.
That is one assumption, and on its own it sounds like a modeling detail. It is not. Turbine rating decides how many positions a gigawatt takes. Push bigger machines further out and the same gigawatt needs more of them: a gigawatt commissioned between 2030 and 2034 now needs around 20% more positions than our Q1 trajectory implied.
Everything else in this assessment follows from that single change.
Why a five-year delay helps the installation market
More positions means more units, and more units means more work: more components to make, more lifts to perform, more vessel days to book.
Counter-intuitively, that is good news for the installation market in the near term. Demand is expressed in more, smaller units for longer, and smaller units are units today's fleet can already handle. The delay buys the installation market roughly a decade of headroom, lifting component counts and vessel days across the forecast period rather than compressing them into a crunch.
This is the part worth being precise about, because it is easy to read as a reprieve. It is not a reprieve. It is a transfer. The constraint moves from how much work there is to what the work requires, and it moves further out in time. A fleet that can absorb more mid-size lifts through the 2030s still has to be able to lift what comes after them.
Where the headroom runs out
Western turbine manufacturers do not get the same reprieve.
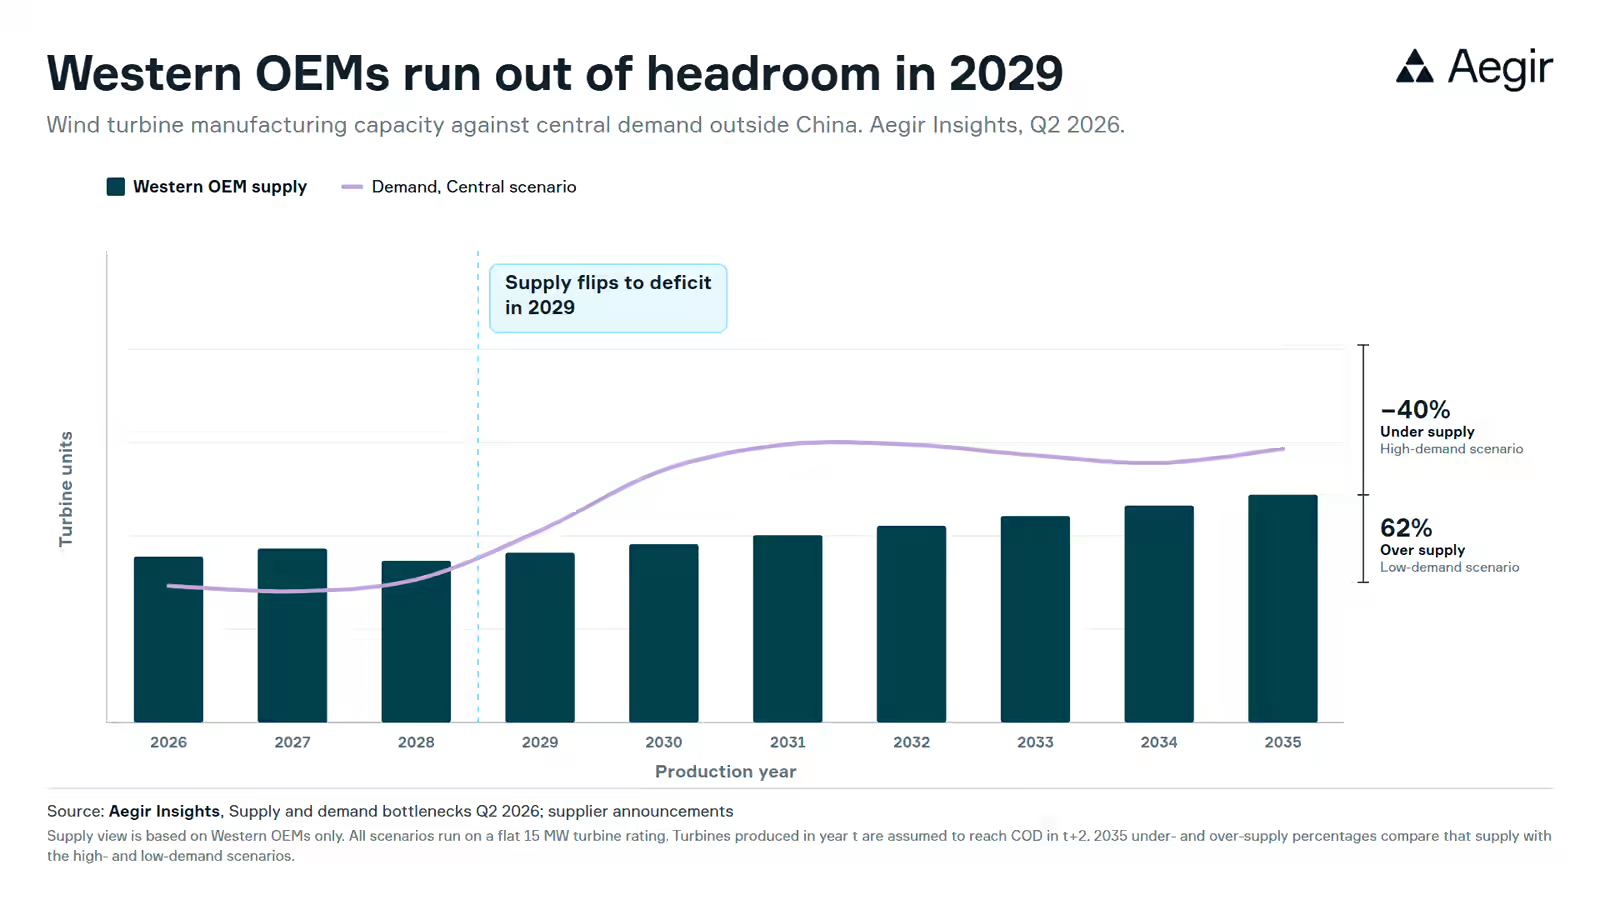
On our supply view, Western OEM capacity runs ahead of central demand through the late 2020s and then stops doing so. Supply flips from surplus to deficit in 2029, and the gap is at its widest in 2031. It narrows again after that, but it does not close inside the forecast period.
The scenario range matters more than the central line here. Measured against 2035:
- Against high demand, Western supply is around 40% short
- Against low demand, it is around 62% over
That is a very wide band, and it is the honest read of the situation. Whether Western manufacturing is short or long depends less on manufacturing decisions than on which demand path the market actually takes. Committing capacity against the central line alone is how a supplier ends up on the wrong side of a 100-point swing.
Worth stating the method plainly, because it bounds the claim: this supply view counts Western OEM nacelle capacity only, runs every scenario on a flat 15 MW rating, and assumes a turbine produced in year t reaches commercial operation in t+2. It is not a statement about global capacity, and it is not a statement about what any individual manufacturer will build.
What this means if you are buying, building or financing
Three practical consequences, in rough order of who feels them first.
If you are procuring turbines, the surplus years are the negotiating years, and they are finite. The window in which Western supply comfortably exceeds central demand closes at the end of this decade. Contracts signed into a 2031 delivery slot are being signed into the tightest year in the assessment.
If you own or charter installation vessels, the delayed rating trajectory extends the useful life of the current fleet by pushing the very large lifts further out. That is a decade of runway, not a permanent condition, and the capability question returns at the end of it.
If you are financing a project commissioning in the early 2030s, the position count is the number to test. A 20% increase in positions per gigawatt is not a rounding error in an installation schedule or a supply agreement.
How this fits with the demand side
This assessment is the supply half of a pair. The demand half, our Q2 2026 Market Forecast, is covered separately in Offshore wind capacity forecast to 2040.
Read together, they say something fairly simple. The volumes are stable. The timing is not. Neither the forecast nor the bottleneck assessment finds the constraint in the project pipeline. Both find it in when things arrive and what shape they arrive in.
Beyond turbines, the full Q2 2026 Supply and Demand Bottlenecks insight also assesses monopile manufacturing capacity against demand, and the availability of the installation vessel fleet through to 2040. Our standing vessel supply and demand analysis covers the fleet side in more depth.
Key questions on offshore wind supply chain bottlenecks
What is the main offshore wind supply chain bottleneck in 2026?
On our Q2 2026 assessment, it is turbine timing rather than volume. Delaying larger turbine ratings by five years means each gigawatt needs around 20% more positions between 2030 and 2034, and Western OEM supply flips from surplus to deficit in 2029.
Does the delay in larger turbines make the bottleneck better or worse?
Both, in sequence. It eases the installation market by keeping demand in units the current fleet can handle, buying roughly a decade of headroom. It tightens turbine supply, because more positions per gigawatt means more machines from a Western manufacturing base that stops covering central demand at the end of this decade.
When does Western turbine supply become a deficit?
In 2029 on the central demand scenario, with the widest gap in 2031. Against a high-demand path the shortfall is around 40% by 2035; against a low-demand path Western supply is around 62% more than needed. This counts Western OEM nacelle capacity only.
Is the offshore wind project pipeline the constraint?
Not on our numbers. We expect 91 GW installed globally by 2030 and 259 GW by 2040, excluding China, and those volumes are close to the previous quarter's. The constraint sits in supply timing and installation capability, not in the pipeline.
Aegir Insights assesses offshore wind supply and demand bottlenecks quarterly, comparing announced manufacturing capacity and installation fleet capability against project-generated demand. Get in touch for a walk-through, or see how the underlying data works in Aegir Analytics.