Insights
Stay ahead of the market.
Analyst-authored briefs, deep-dive research and Wavelength webinars. The fastest way to keep your team current on what's moving in renewables.
Featured · Company news
Aegir Insights launches next-generation energy intelligence platform
The new Aegir Platform brings project-level data, market intelligence and investment modeling together in one environment across onshore wind, offshore wind, solar, storage and data centers.
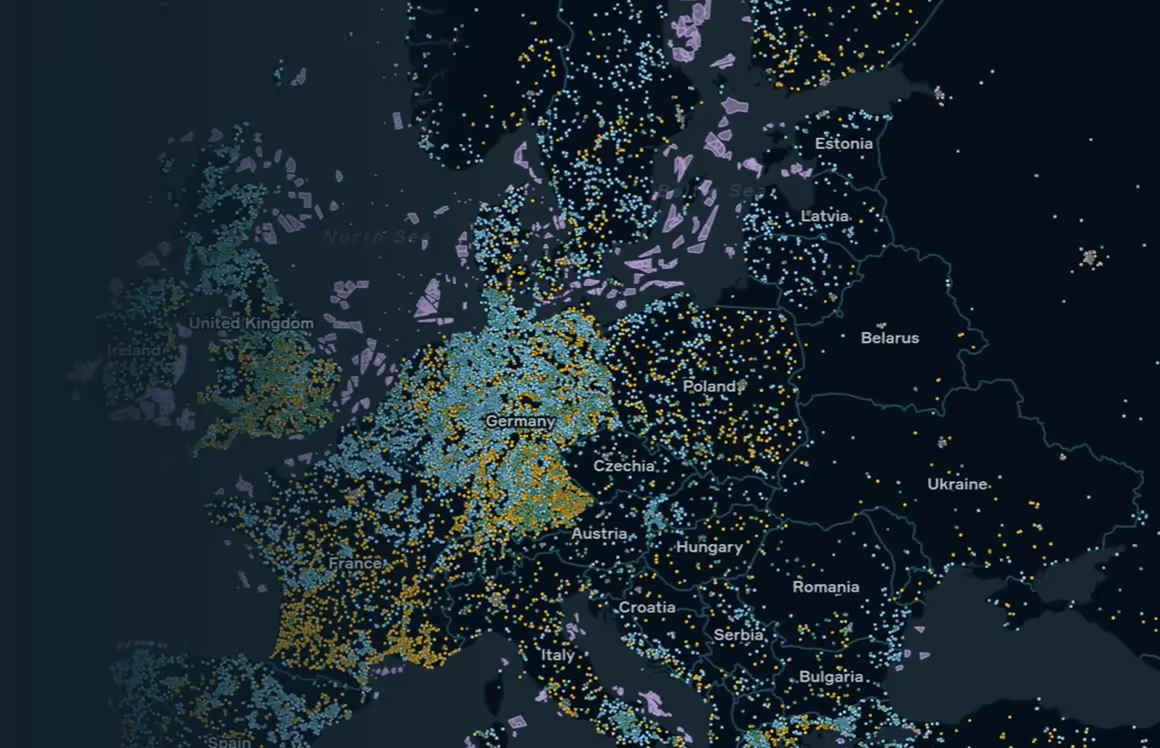
The latest insights
October 27, 2026
Supply chain
Offshore wind
Europe
Poland
Denmark
Germany
Netherlands
Belgium
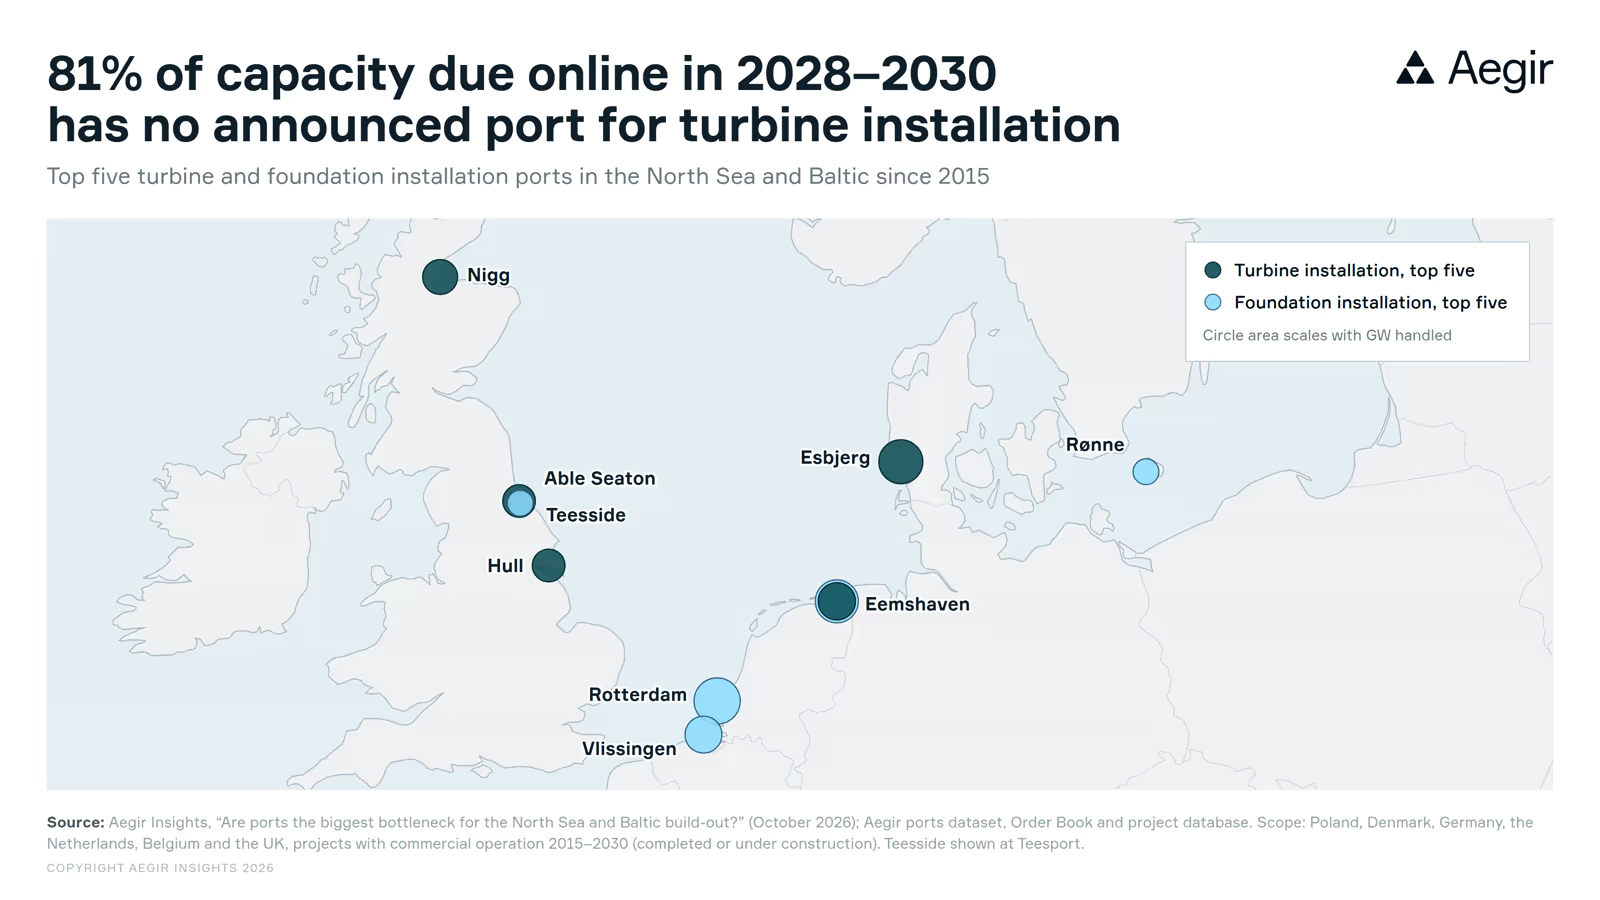
Are ports the biggest bottleneck for the offshore wind build-out in the North Sea and Baltic?

October 22, 2026
Auctions
Offshore wind
Europe
Belgium
Germany
Ireland
Netherlands
France
Are upcoming European offshore wind tenders going beyond NZIA’s minimum requirements?
October 20, 2026
No items found.
Offshore wind
Europe
APAC
No items found.
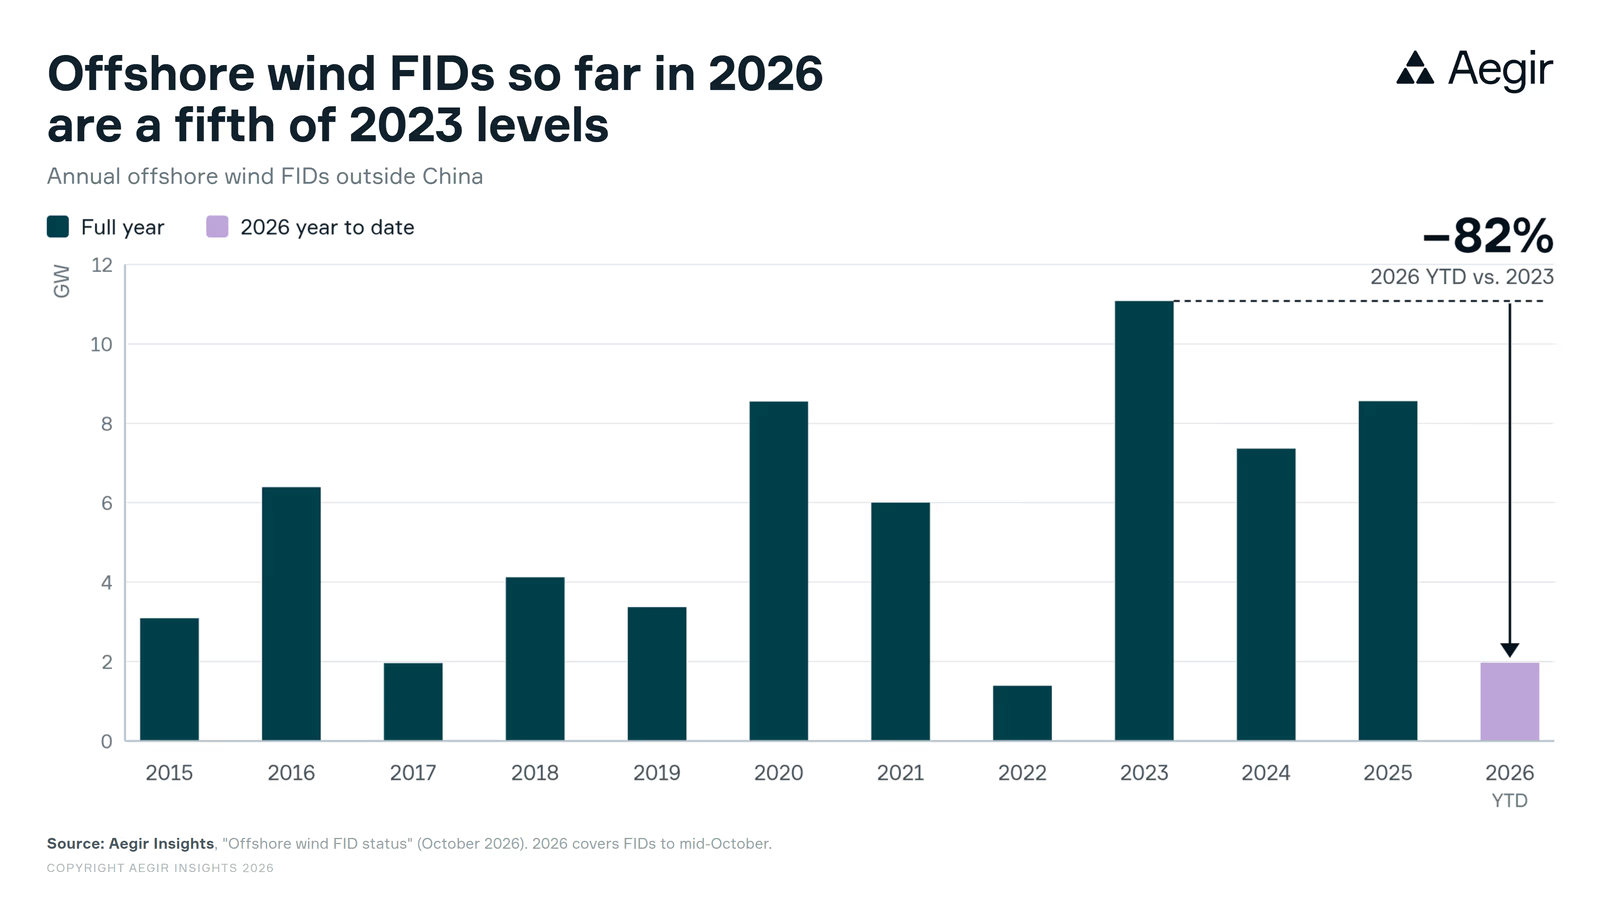
The slump of offshore wind FID volumes outside China

October 15, 2026
No items found.
Onshore wind
Solar
Storage
Europe
No items found.
Europe’s hybrid storage projects, mapped
October 14, 2026
Supply chain
Offshore wind
Europe
Germany
United Kingdom
Denmark
Poland
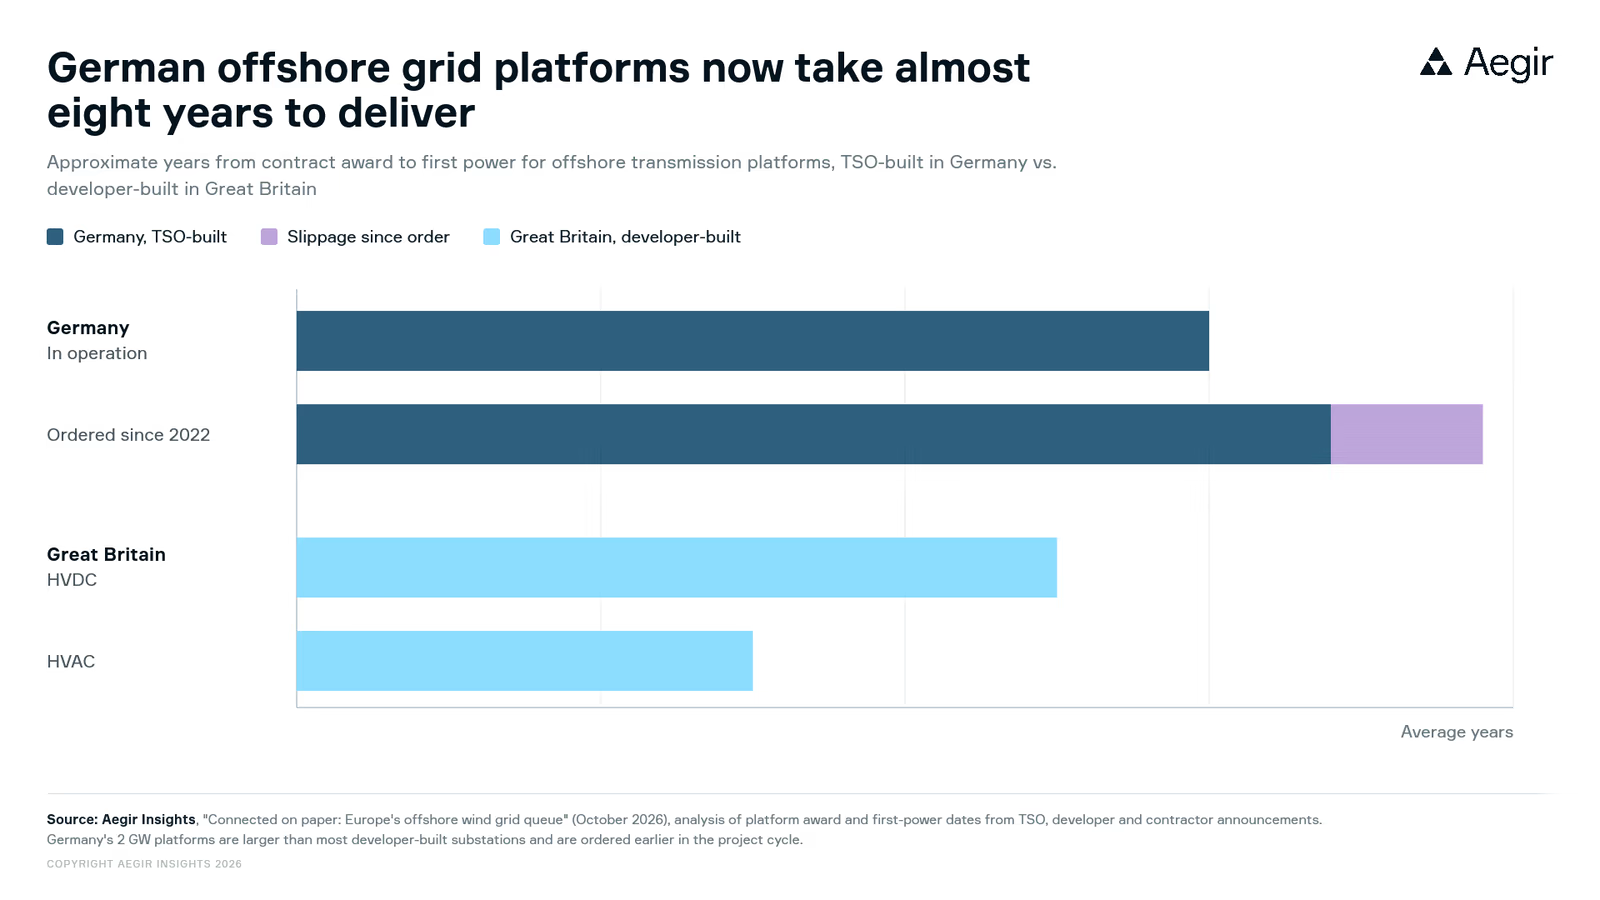
Connected on paper: Europe’s offshore wind grid queue

October 13, 2026
Auctions
Onshore wind
Solar
Europe
Ireland
Sizing the competition in Ireland’s RESS 6 auction
October 8, 2026
Auctions
Onshore wind
Europe
Germany
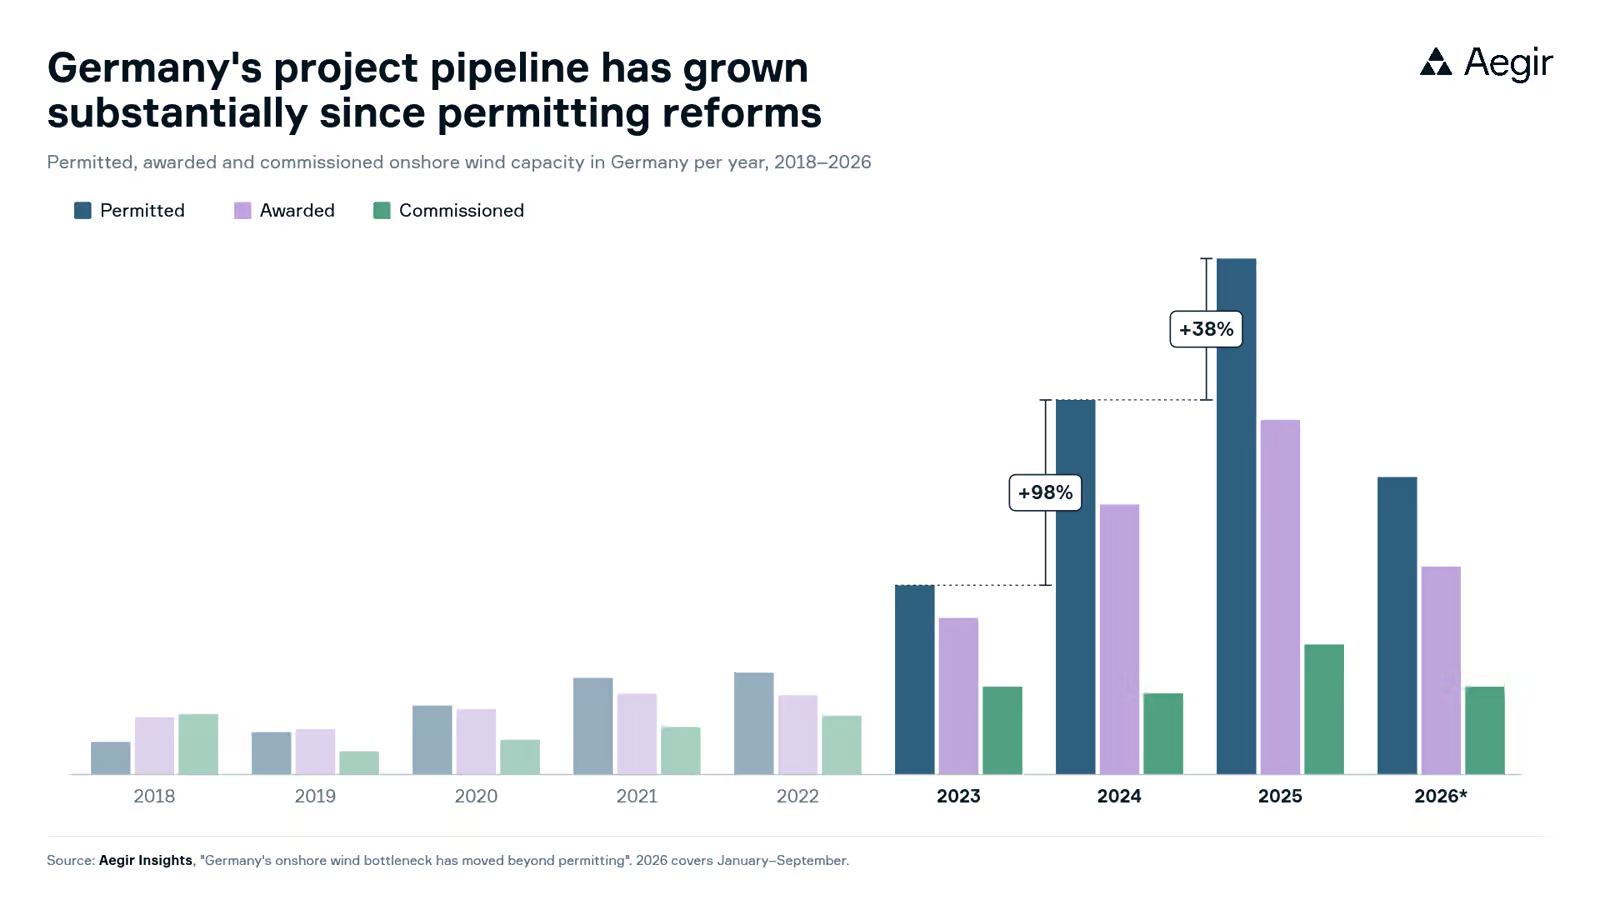
Germany's onshore wind bottleneck has moved beyond permitting

October 6, 2026
Forecast
Offshore wind
Europe
APAC
North America
South Korea
United States
Offshore wind capacity forecast to 2040: What moved this quarter
October 1, 2026
Company news
No items found.
No items found.
No items found.
Aegir Insights launches next-generation energy intelligence platform
September 30, 2026
Supply chain
Offshore wind
Europe
United Kingdom
Germany
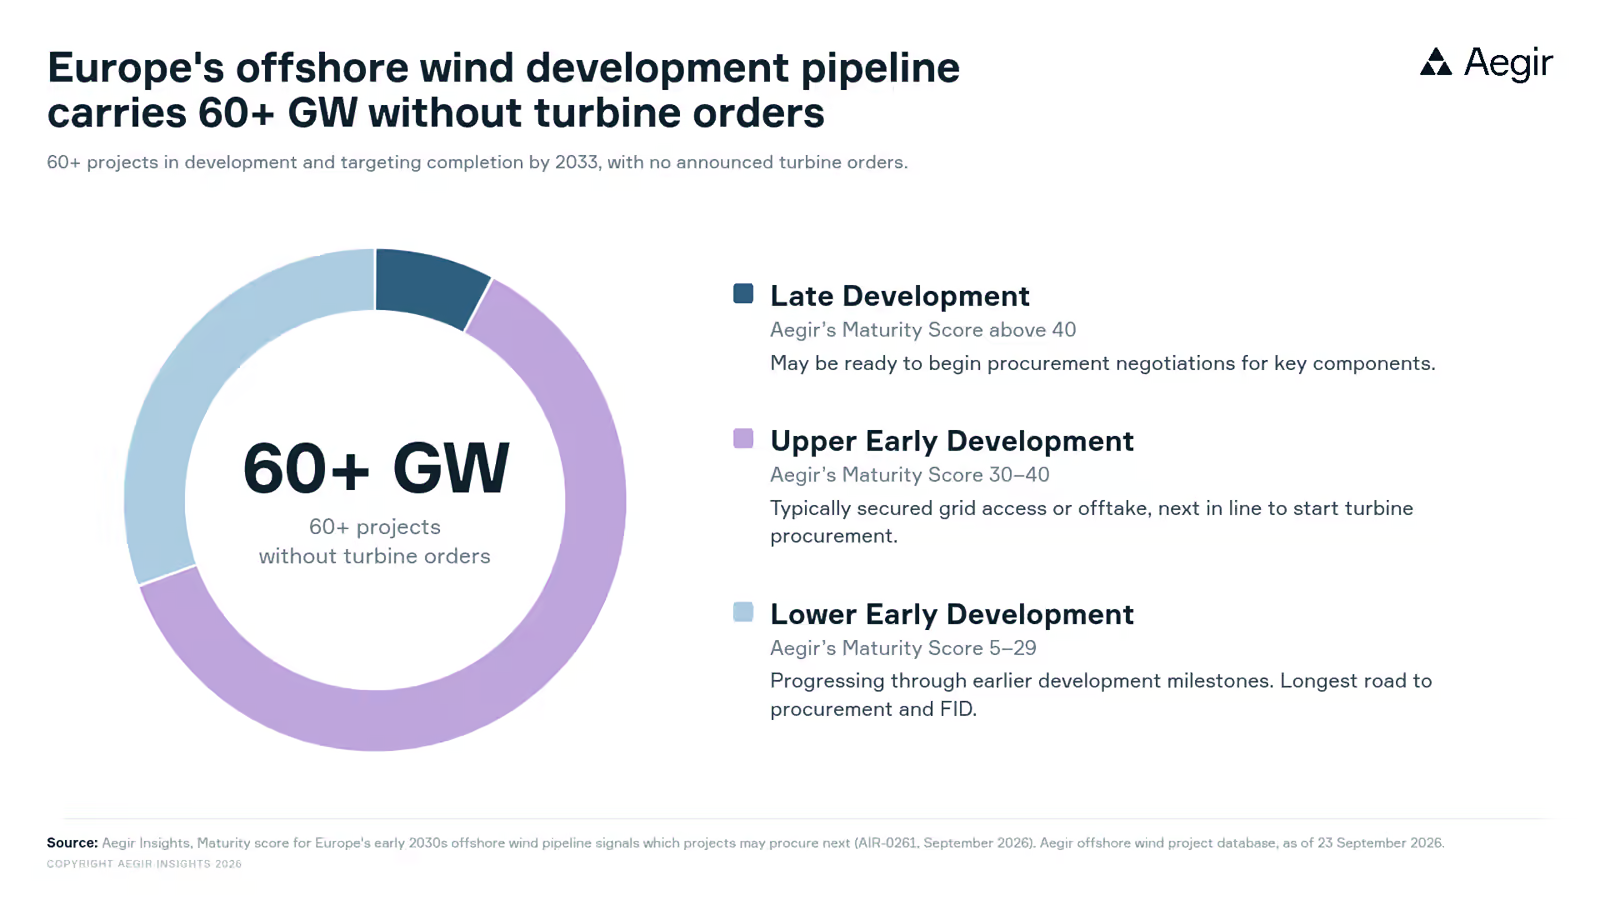
Europe's early 2030s offshore wind pipeline holds 60+ GW of supplier opportunities
September 29, 2026
No items found.
Data centers
Onshore wind
Offshore wind
Solar
Europe
Ireland
Netherlands
Spain
Finland
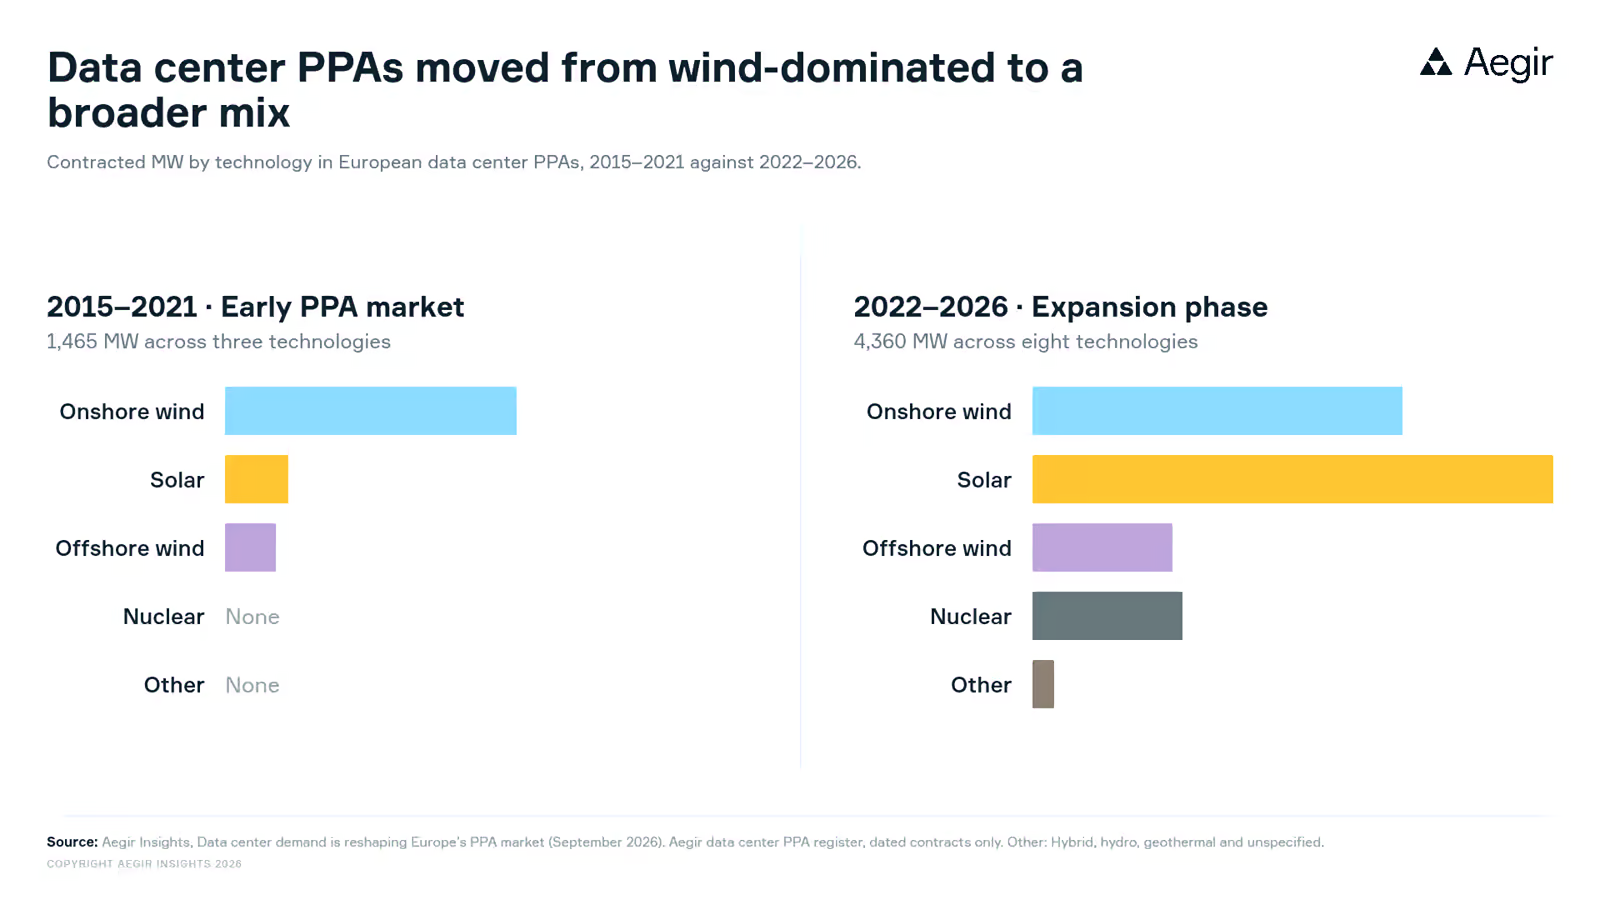
European data center power contracting has almost tripled since 2022
September 22, 2026
Auctions
Onshore wind
Solar
Europe
United Kingdom
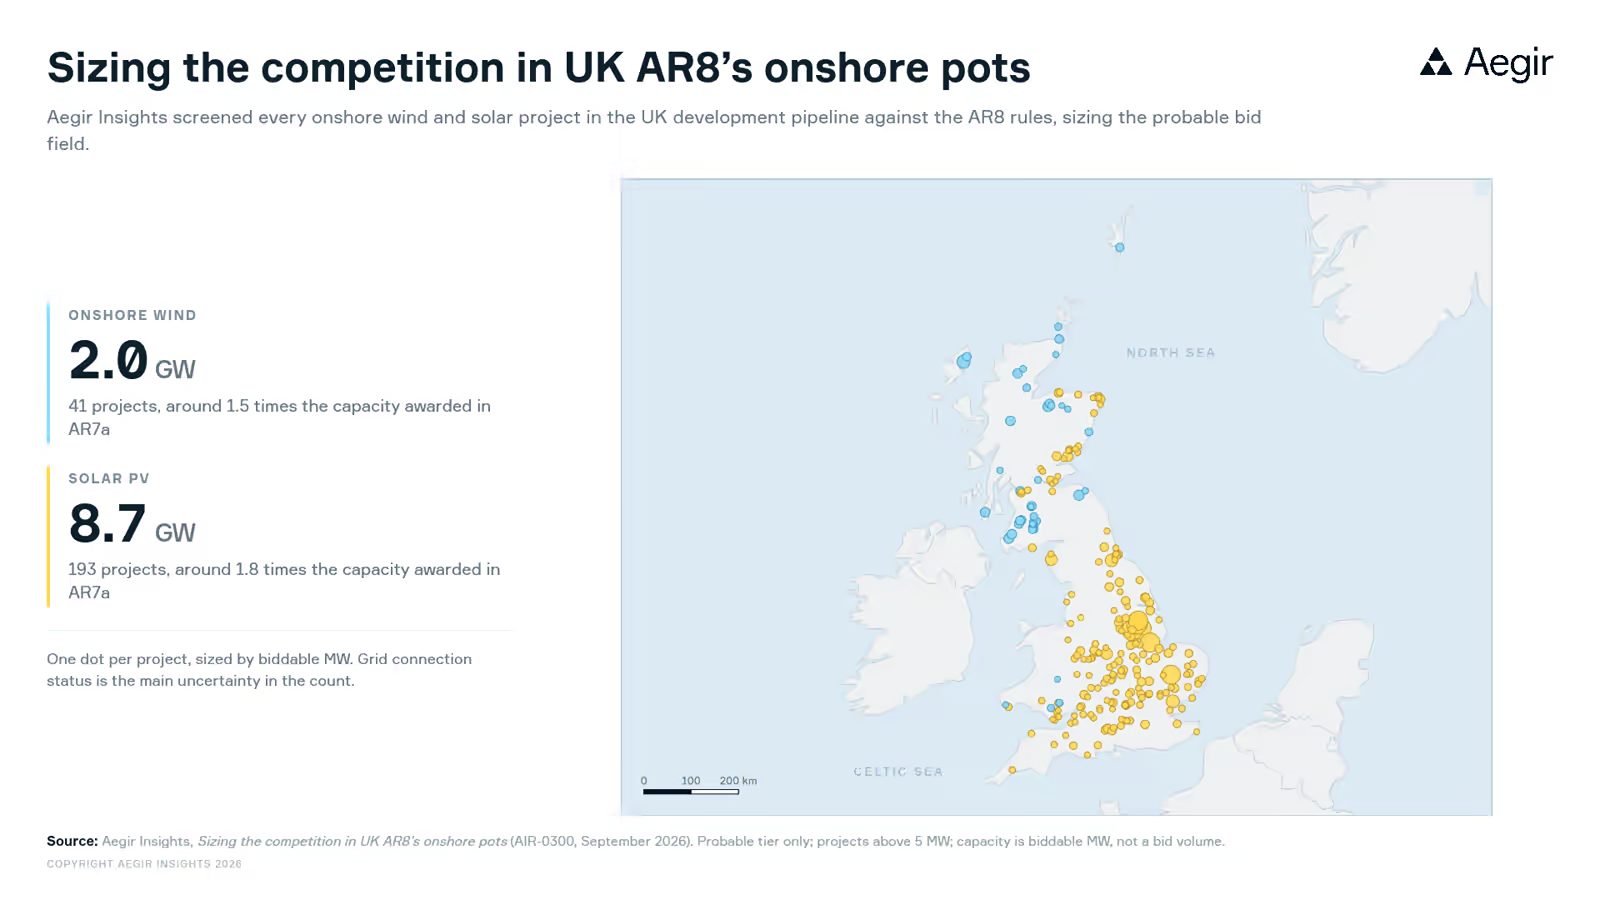
UK AR8 eligibility: Sizing the onshore bid field
September 17, 2026
No items found.
Storage
Offshore wind
Europe
North Sea
Denmark
United Kingdom
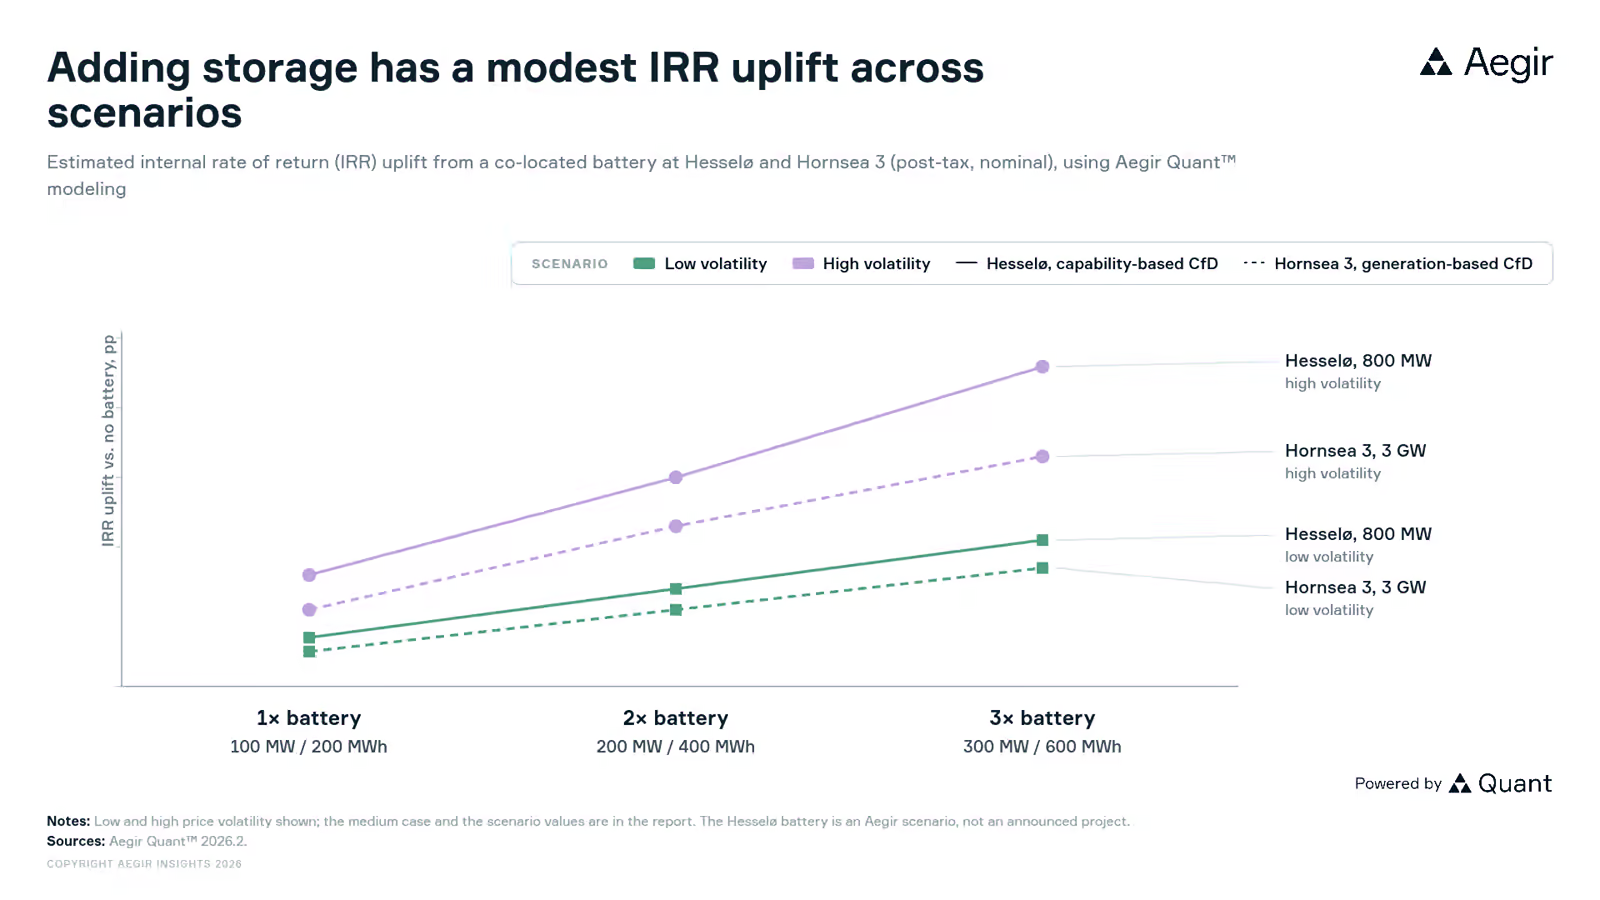
Size the battery and bet on volatility: What co-located storage does to offshore wind returns
September 15, 2026
Forecast
Onshore wind
North America
United States
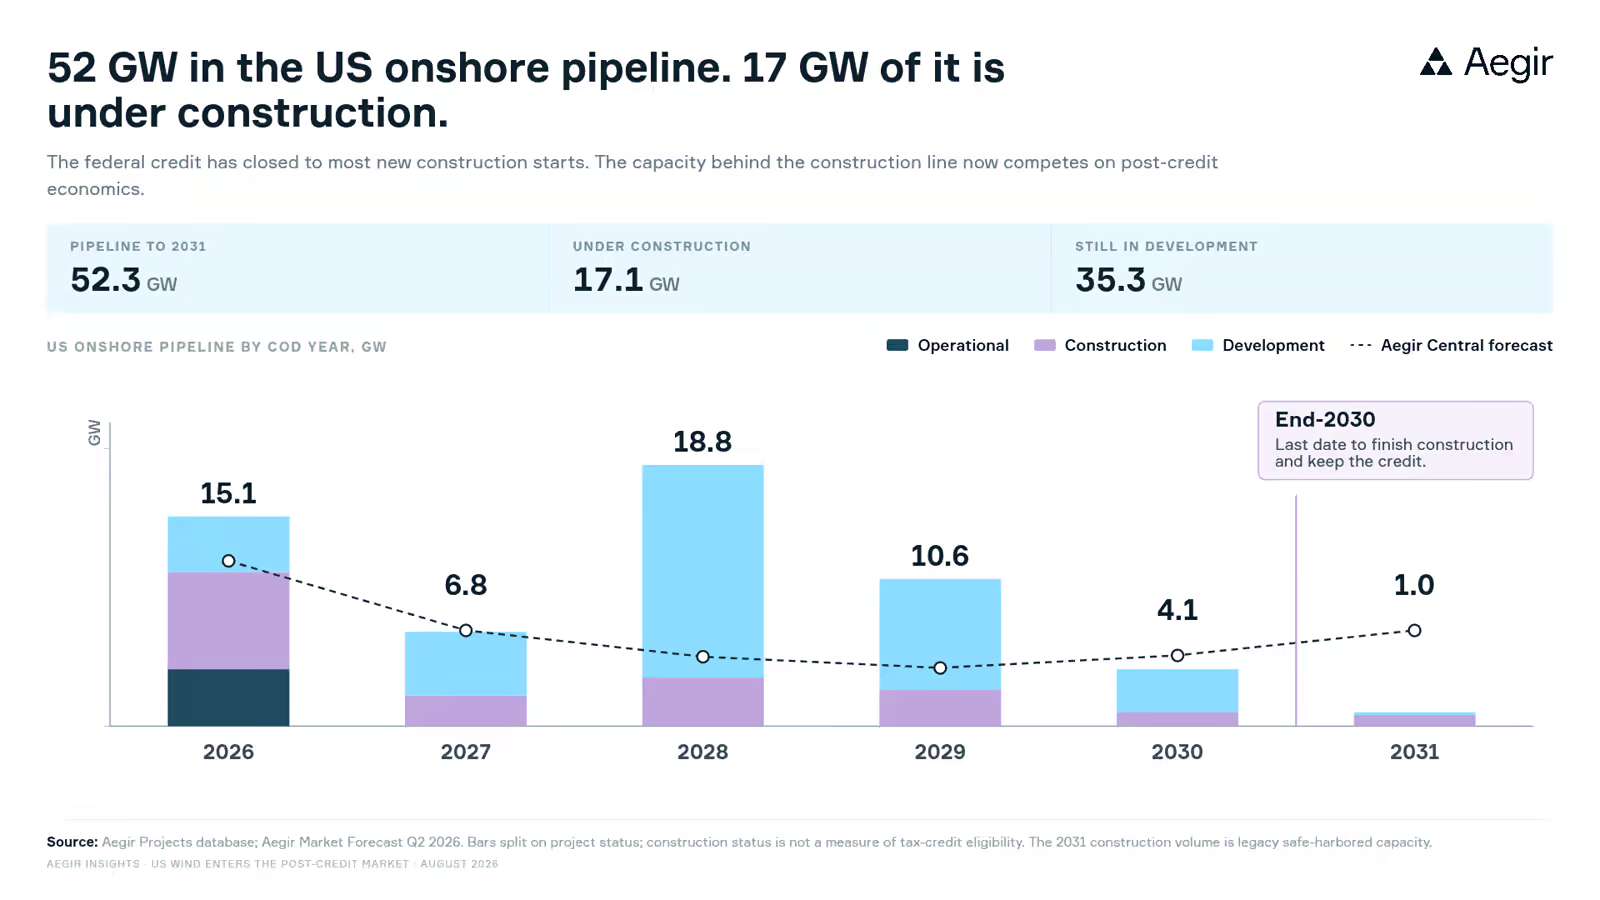
Best demand, worst policy: US onshore wind enters the post-credit market
September 10, 2026
Auctions
Offshore wind
Europe
North Sea
Denmark
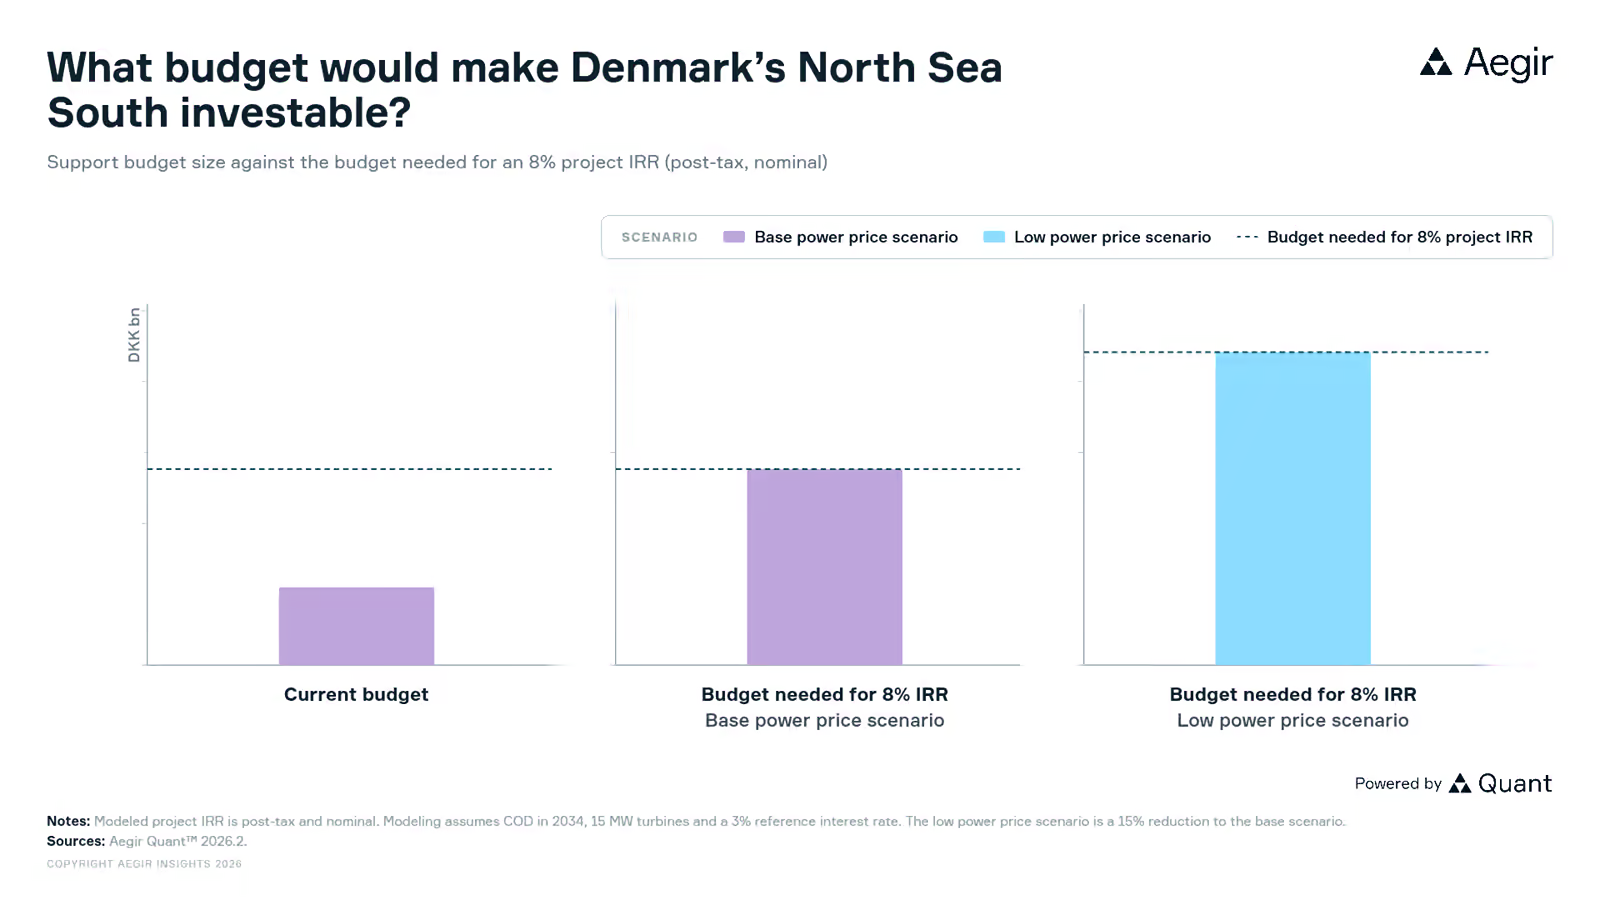
What budget would make Denmark's North Sea South investable?
About
Independent intelligence, built by industry professionals.
With Aegir Insights, you can tap into 100+ years of combined renewable energy expertise from leading developers, investors,suppliers and regulators, in one place.
100+
Years combined experience
Across the team
20+ GW
Of development experience
Globally
50+
Clients globally
Developers to governments
500+
Face-to-face sessions
Workshops & briefings
Webinar library
Recent Wavelength webinars
Request access to the recording from any recent session.
8 June 2026More than EUR 39bn of supply chain contracts hang on 10 German projects that may never reach FIDRequest access →19 February 2026Required support levels to make European offshore wind great againRequest access →20 January 2026UK CfD AR7 results debriefRequest access →9 December 2025Which European offshore wind auctions are above water and which risk sinking?Request access →10 November 2025Could Chinese OEMs be what Brazil needs to enable offshore wind?Request access →


